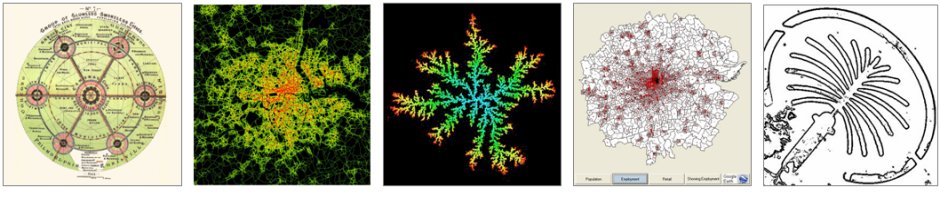
Philip Steadman from the Bartlett Grad School and a team at the Open University back in 1996-7 developed a sketch model based on the von Thunen’s theory of land rent. This was designed to teach beginning students of technology about the land use structure of cities in urban economic terms. It is so simple and intuitively attractive that we still use it a lot to demonstrate the idea of how simple models can be brought alive by simple software. An implementation of the von Thunen model was first implemented in the IDRISI software by Randy Dodson at the NCGIA in the early 1990s from an idea by Waldo Tobler. Following the instructions below, this program can either be run from this web site or it can be downloaded for use on your own desktop. Note that it is a Windows program and won’t run on a Mac.
 OR
OR 
You can download either as an executable directly (above left) or as a zipped up package of executable and map files that you can load in as backgrounds (above right).
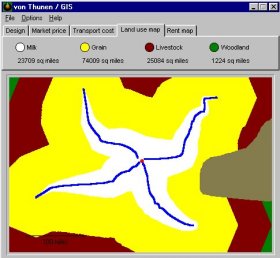
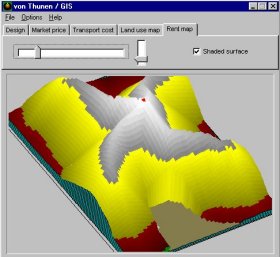
 In essence what this software does is present the user with a blank homogeneous plain, in the terminology of urban economics – a landscape on which a central place or market or town is ‘planted’. This is shown above left. The user can then use the drawing tools in the Design mode to add more towns, transport routes, rail routes, and non-productive land which act as constraints on the distribution of land uses. If there are no constraints (other than just the placement of the central node), then the model generates a symmetical land use pattern around the central town., shown above right. The land use pattern depends on how the transport and market price lines – bid rent curves in the jargon – interact with each other, as in the graphs above
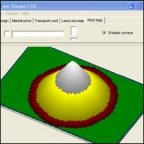
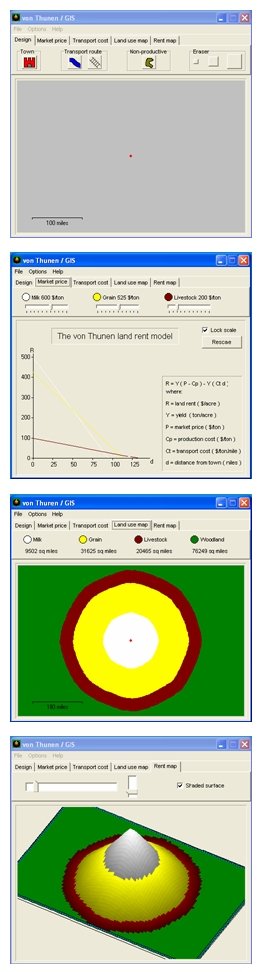
Essentially the von Thunen model assumes that land use is determined by the market price less the transport cost and from the interaction of these bid rent curves, a land use will dominate at any point a given distance from the town centre (or from centres of competing towns). You can also alter the shape of the bid rent and cost curves using sliders. You can then display the land use map as a 2D map or as a 3-D surface of rents, as above right. You can manipulate this surface using sliders in an oblique projection. The various pictures to the right below show you the sequence of steps in the program using a single town – the red dot in the middle of the top screen shows the location, and then the bid rent curves which the user can adjust. The circular town configuration of land uses is shown alongside and finally this can be seen in 3-D. You can import map pictures of real places and run the von Thunen model with towns and roads etc. planted on such backcloths. You can access the drop down menus to do this and you can also change the weights that way and incorporate a fuzzy distance calculations.
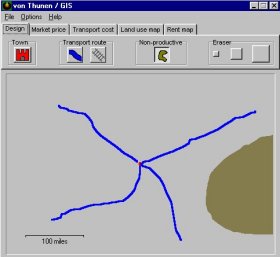
The following is an example with various distortions added by the user to the homogenous plain produced using the application:
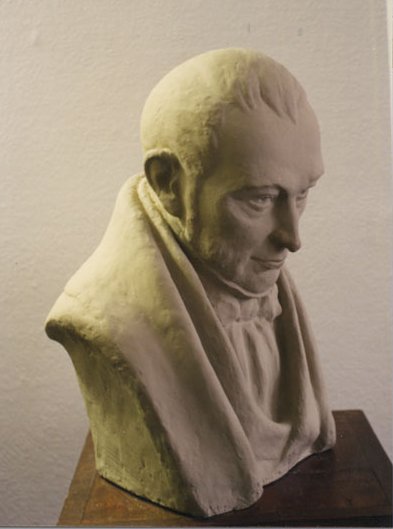
If you want to learn about von Thunen’s Model, then the 1826 book was translated in 1966 under a project run by our own Peter Hall (who is still here in the Bartlett). This is Johann Heinrich von Thünen (1783-1850) (1966) Von Thuènen’s ‘Isolated state’ : an English edition, translated from the German by Carla M. Wartenberg; edited with an introduction by Peter Hall, Pergamon Press, 1966.
 Phil Steadman besides initiating this software project, has written many interesting books that revolve around our work here on a science of cities; in particular his The Evolution of Designs: Biological Analogy in Architecture and the Applied Arts (Cambridge University Press , 1979, reprinted in a revised edition by Routledge in 2008) is a veritable classic. Architectural Morphology: An Introduction to the Geometry of Building Plans (Pion,, 1983), and his celebrated Vermeer’s Camera: Uncovering the Truth Behind the Masterpieces (Oxford University Press, 2001) are essential reading for morphologists and evolutionists.
Readers should also note that the The Thünen Society, North American Division was founded by the group who developed quantitative geography in the University of Washington in the late 1950s: Garrison, Marble, Berry, Nysteun, Morrill, Getis, Tobler who appear all over a science of cities and who really moved the field from ad hoc, oblique and idiosyncractic insights into the mainstream …. this is an approximate truth, of course, but it is a nice story and provides a nice sense of closure.